Mathematics
Grade 9 De-streamed, following the Ontario curriculum.
- 8 units
- 36 lessons
- 391 practice questions
- 282 flashcards
- 4 simulators
Units
Number Sets and Powers
The families of numbers from natural to real, how different cultures built the number ideas you use every day, and how powers, exponent laws and scientific notation handle very large and very small numbers.
Rational Numbers and Proportional Reasoning
Integers and fractions with signs, reading imperial measurements, the four operations with positive and negative fractions, and the ratios, rates, proportions and percentages behind prices, maps and taxes.
Algebraic Expressions and Equations
Write expressions from patterns and words, simplify and compare them, solve linear equations step by step, and rearrange formulas you use in real life.
Coding with Python
Use Python to store values in variables, evaluate formulas, build tables of values and patterns with loops, and test inequalities with conditionals, then read code and change it to model new situations.
Linear and Non-Linear Relations
Tell linear and non-linear relations apart, describe a linear relation by its rate of change and initial value, write y = mx + b from a graph, table or story, compare two relations, and graph special lines, regions and transformed lines.
Data and Mathematical Modelling
How data is collected, stored and used in society and what can go wrong, how to summarize one-variable data with centre, spread and box plots, how to read relationships in two-variable data, and how to build and test a mathematical model.
Geometry and Measurement
Use angle, triangle and circle relationships to analyse designs, convert between metric and imperial units, apply the Pythagorean theorem, predict how scaling changes area and volume, and find the volume of prisms, pyramids, cylinders and cones.
Financial Literacy
Inflation and the Consumer Price Index, needs and wants, appreciation and depreciation, simple and compound interest and the true cost of borrowing, and building a budget that still works when your income or rent changes.
Simulators
Simulators for every course →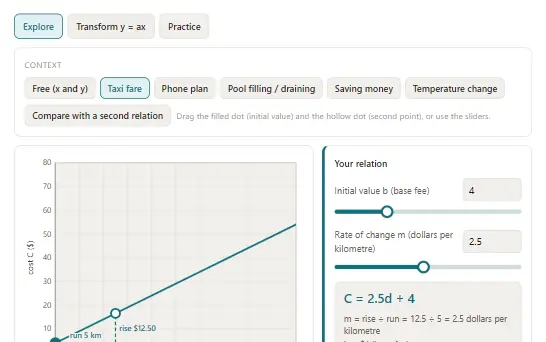
 MTH1W
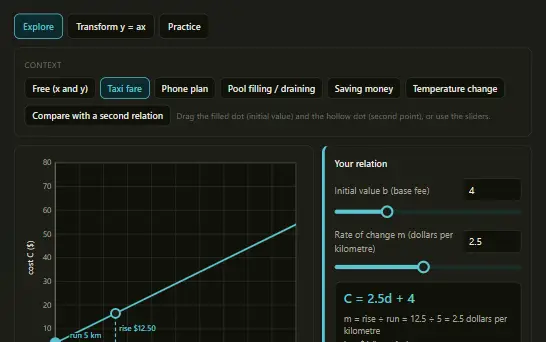
Set the initial value and rate of change in a real context and watch the story, table, graph and equation change together, then compare two options and see where and why they cross.
 MTH1W
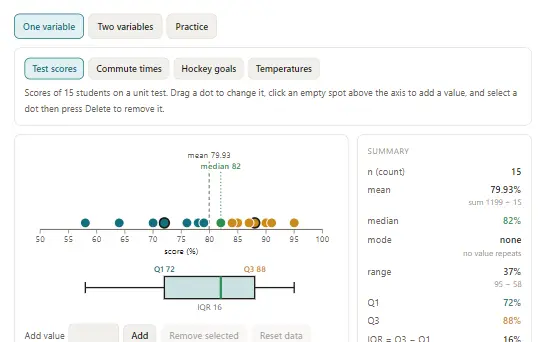
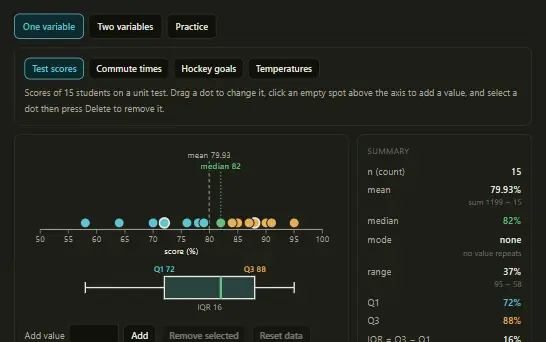
Drag values on a dot plot to watch the mean, median, quartiles and box plot respond, then fit lines and curves to scatter plots and judge correlation and predictions.
 MTH1W
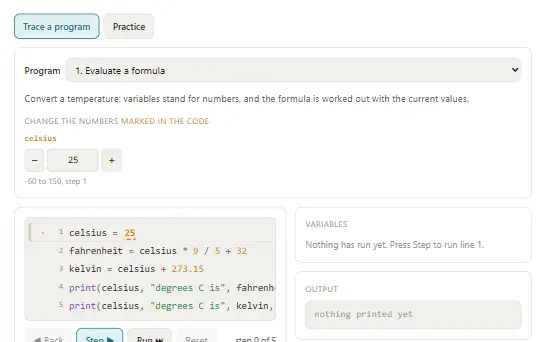
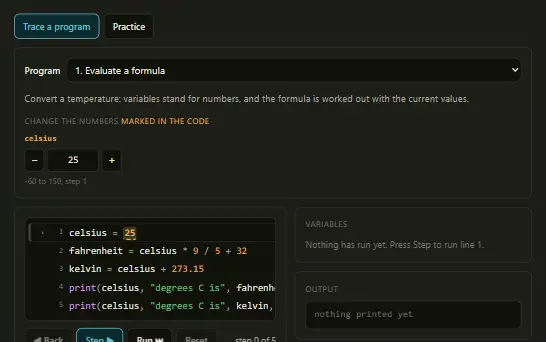
Step through short math programs one line at a time, watching each variable's value and type and the output, then change the marked numbers to model a new situation.
 MTH1W
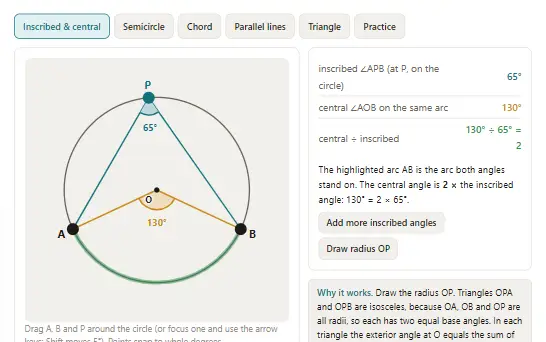
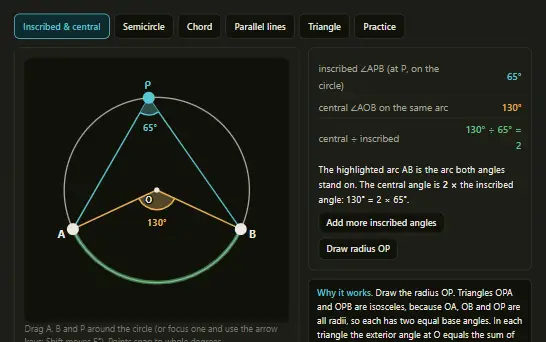
Drag points to see why inscribed and central angles, the angle in a semicircle, chord bisectors, parallel-line angle pairs and triangle properties work, with every measure taken from the diagram.