Skip to content
Study Hall
Lesson 10 of 10Trigonometric Functions
Unit 4 · Lesson 10 of 10

Modelling with Sinusoidal Functions

Ferris wheels, tides, daylight hours, and temperature all repeat in a roughly sinusoidal pattern — learn to translate a real description into an equation.

6 min read12 practice questionsAsk AI about this →

Key things to remember

  1. 1Axis: . Amplitude: . Both always come first.
  2. 2.
  3. 3If a scenario starts at a maximum, model with ; if it starts at a minimum, model with ; if it starts at the axis rising, use .
  4. 4Once are set from the max/min/period, only the starting behaviour decides which parent function and sign to use — often avoiding the need for a term entirely.
  5. 5In context: is the average level (a Ferris wheel's centre height), is half the range (the radius), the period is the time for one cycle, and is the time of the chosen starting feature.
  6. 6To find WHEN a model reaches a value: set it equal, isolate the trig ratio, use the related angle and CAST (or read the graph), then add whole periods for later cycles. Each value between max and min occurs twice per cycle.

Anything that cycles smoothly and repeatedly — a Ferris wheel's height, ocean tides, the number of daylight hours across a year, average monthly temperature — can be modelled with a sine or cosine function. The whole skill here is translating a word description into the four parameters , , , (or picking whether to start from sine or cosine). Why bother? A model lets you answer questions the description never stated directly: how high a rider is 13 seconds in, whether a boat can clear a sandbar at 3 p.m., or in which months the average temperature rises above 15 °C. Each parameter also has a physical meaning, so once you can read a model you can describe the situation it came from, and once you can describe a situation you can write its model. The same four numbers do all the work every time; only the story around them changes.
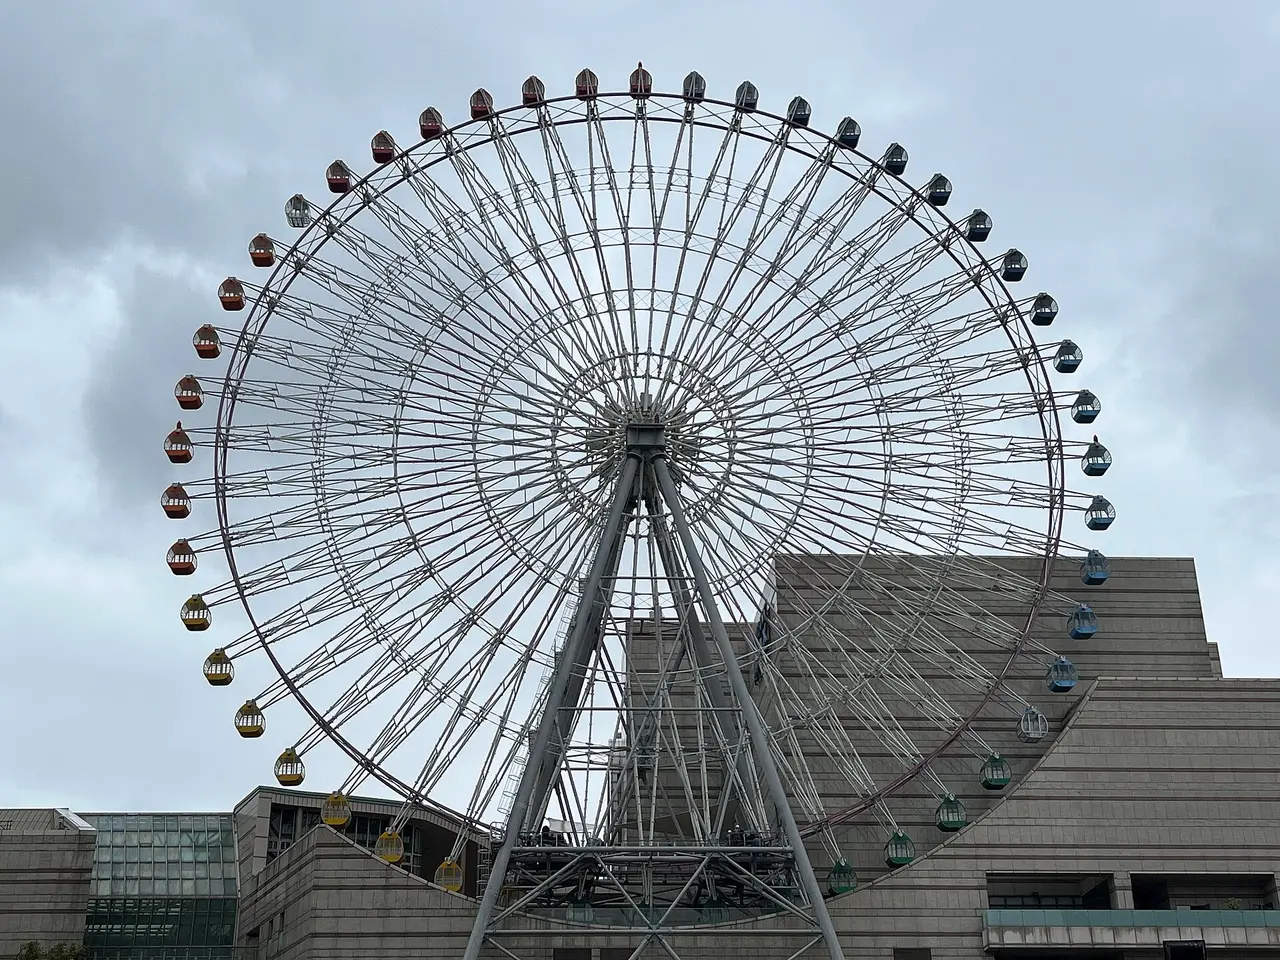
A large white Ferris wheel with coloured cabins around its rim, seen from the side against a cloudy sky above a building.
PhotoThe Miramar Ferris Wheel in Taipei. As the wheel turns at a steady speed, a cabin's height above the ground rises and falls in a repeating, wave-like way, which is why sine and cosine functions model it.Another Believer, CC BY-SA 4.0, via Wikimedia Commons

The translation checklist

  1. Find the maximum and minimum values described (or read off a table/graph).
  2. Compute the axis, , and the amplitude, .
  3. Find the period (how long for one full repeat), then compute .
  4. Decide whether the situation starts at a maximum, a minimum, or the axis — that choice decides whether to build from cosine (starts at max/min naturally) or sine (starts at the axis naturally), and fixes the sign and value of .
midline (axis)amplitudemaximumminimumperiod = 360°y = sin(x) — phase shift = 0° (starts at the midline, rising)
Fig 1Matching a real scenario's high point, low point, and cycle length onto the anatomy of a sinusoidal graph.

Why does each step work? The axis is the AVERAGE of the maximum and minimum because a sinusoid spends exactly as long above its midline as below it, and rises just as far above it as it falls below it; the midline sits halfway between the extremes. The amplitude is HALF the range, , because the range covers the climb from the axis to the top plus the drop from the axis to the bottom, two equal amplitudes. For , remember that the angle inside the cosine must sweep through during one cycle of the real situation. If one cycle takes seconds, the angle has to grow by every second, and that rate is . Finally is just a TIME: the moment the chosen parent function starts its cycle (a maximum for , a minimum for , a rising axis crossing for ).

Start from the bottom with negative cosine
If the situation starts at its LOWEST point, use (since normally starts at a maximum, flipping it with a negative sign makes it start at a minimum instead) — this avoids needing an awkward phase shift.

Ferris wheels: from a circle to a wave

h(t) = −10cos(9t°) + 12a = 10 (radius), c = 12 (centre height), k = 360 ÷ 40 = 9r = 10 m12 mABCDA: t = 0 sB: t = 10 sC: t = 20 sD: t = 30 sh (m)02122201020304050607080time t (s)maxaxisminperiod = 40 sa = 10ABCDA
Fig 2A wheel with its centre 12 m up, radius 10 m and one turn every 40 s. Boarding at the bottom, the rider's height runs from 2 m at t = 0 up to 22 m at t = 20 s and back to 2 m at t = 40 s, giving h(t) = -10cos(9t) + 12.

A Ferris wheel is the cleanest model because every parameter is a piece of the wheel. The centre height is the axis, since the rider is above the centre for half the turn and below it for the other half. The radius is the amplitude, since the rider is never more than one radius above or below the centre. The time for one rotation is the period, and the wheel turns through each second, which is . Where the rider boards decides the parent: boarding at the bottom means the height starts at its minimum, so fits with . For the wheel in the figure, . Read the graph against the wheel: a quarter-turn ( s) puts the rider level with the centre at m, a half-turn ( s) puts them at the top, m, and three quarters ( s) brings them back to m on the way down. If the wheel's platform is raised, only changes; a bigger wheel changes (and usually too, because the centre must rise to keep the bottom off the ground); a faster wheel changes only .

ParameterFerris wheelTidesDaylight or temperature
(axis)Height of the centreMean water depthAverage over the year
(amplitude)Radius of the wheelHalf the gap between high and low tideHalf the gap between the extreme months or days
Period Time for one rotationAbout h between high tides months or days
(phase shift)Time the rider is at the chosen start pointTime of a high (for ) or a low (for )Date of the peak, or of the rising midpoint (for )
Each parameter has the same job in every context; only its real-world name changes.
VideoSal Khan works through a Ferris wheel height problem in degrees, using the wheel's size, the height of its lowest point and how fast it turns to find riders' heights.Watch on YouTube

Modelling from a table of data

Real data rarely arrives as a tidy description. Given a table, scan for the largest and smallest readings (these give and ), find how long it takes for the pattern to repeat (the period, then ), and note WHEN the largest reading occurs (that time is for a model). The monthly average temperatures below peak at °C in month (July) and bottom out at °C in month (January), repeating every months. So , , and, using the July peak, . Using the January low instead gives , the same curve. Real measurements wobble a little, so a model fitted from data is judged by how closely it tracks the table, not by hitting every value exactly.

Month Temp (°C)Month Temp (°C)
Monthly average temperatures for a model city. The values are symmetric about July, the hallmark of a sinusoid.

When does the model reach a given value?

Many exam questions run the model backwards: given a height or depth, find the TIME. On a graph, draw the horizontal line at that value and read the -values where it cuts the curve; between the maximum and minimum, every value is reached TWICE per cycle, once rising and once falling. With the equation, isolate the trig ratio and use special angles and the CAST rule. For the Ferris wheel, when is the rider at m? Set , so and . The related angle is , and cosine is negative in quadrants II and III, so or , giving s (rising) and s (falling). Notice the two times sit symmetrically around s, the moment the rider is at the top; symmetry about a maximum or minimum is a quick check on any pair of answers.

Every answer repeats each period
If the question asks about a later cycle, add whole periods: the rider is also at m at s and s. If it asks for HOW LONG the quantity stays above a value, subtract the two times within one cycle ( s per turn above m). Always check that your times fall inside the window the question gives.

Worked examples

Reveal one step at a time and try to beat it to the next line.

Example 1
A Ferris wheel has a radius of 10 m, with its centre 12 m above the ground. It completes one full rotation every 40 seconds, and a rider boards at the very BOTTOM of the wheel at . Write an equation for height in metres, in terms of time in seconds.
Example 2
Using from above, find the rider's height after 10 seconds and after 20 seconds.
Example 3
At a certain harbour, high tide is m and low tide is m, with the water level following a repeating -hour cycle. High tide occurs at . Write an equation for water depth in metres.
Example 4
Using the monthly temperature table in the lesson (low °C in month , high °C in month , repeating every months), write a model that starts at the January minimum. Then find the months when the average is exactly °C, and for how many months it is above °C.

Where marks get lost

  • Jumping straight to a phase-shifted sine formula instead of first checking whether the scenario naturally starts at a max or min — using is almost always simpler than forcing with an awkward .
  • Computing the axis or amplitude from the WRONG pair of numbers (e.g. using the radius as the axis instead of the centre height, in a Ferris wheel problem).
  • Forgetting to convert the given cycle length into , and instead leaving the raw period number inside the trig function.
  • Mixing units (e.g. writing in minutes in one part of the formula and seconds in another) — keep the time unit for consistent throughout.
  • Stopping at one time when asked when the model reaches a value: on a Ferris wheel with , the rider is at m both rising ( s) and falling ( s), and again every s after that.

Flashcards 9

Modelling checklist
Starts at a maximum
Starts at a minimum
Starts at the axis, rising
+ 5 more

Practice

1
A Ferris wheel has radius 8 m, centre height 10 m, period 30 s, and a rider starts at the bottom. Find the amplitude .
2
Using the same wheel (radius 8, centre 10, period 30 s), find (round to 2 decimals).
°/s
3
If a rider starts at the TOP of a Ferris wheel at , which model form needs no phase shift?
4
In a sinusoidal application, what does the 'axis' value represent physically (in general terms)?
5
Daylight hours in a city vary from a minimum of 9 hours to a maximum of 15.5 hours over a 365-day cycle. Find the amplitude.
hours
6
Using the same daylight data (min 9, max 15.5), find the axis.
hours
7
For the harbour tide model (from the worked example), find the depth at hours.
m
8
A Ferris wheel is modelled by , with in metres and in seconds. What does the represent?
9
For the tide model ( in hours after high tide), when does the depth FIRST fall to m?
h
10
A rider on the wheel boards at the bottom. For how many seconds of each rotation are they higher than m?
s
11
Match each part of to its meaning for the Ferris wheel.
The negative sign
12
Put the steps of this lesson's translation checklist for modelling a situation with a sinusoid in order.
  1. 1Check the model at a known point
  2. 2Choose , or and from the starting behaviour
  3. 3Find the period and compute
  4. 4Identify the maximum and minimum values
  5. 5Compute the axis and amplitude

Spot a mistake on this page? Let us know